The carbon payback of a solar panel is the time it takes for the electricity that panel generates to offset the carbon dioxide equivalent (CO2e) released in making, shipping, installing and eventually recycling it. For modern crystalline silicon panels that usually works out to one to two years, though the realistic range runs from roughly six months on a clean, sunny grid to several years for panels made on coal-powered grids and sold into coal-heavy ones.
That is a climate number, not a money number, and most search results confuse the two. This guide stays on carbon: what the figure means, how it is calculated, what moves it up or down, and how you can work out your own.
A useful mental model is that a panel is a small carbon-emitting factory that happens to produce a carbon-free product. The factory runs for a while, then the product starts paying the debt off faster than a new panel behind it can add to it. Once that point arrives, every further kilowatt-hour is a net reduction for as long as the panel keeps generating.
Table of Contents
- What Is the Carbon Payback of a Solar Panel?
- How Is the Carbon Payback of a Solar Panel Calculated?
- What the formula needs from you
- Where a panel’s embodied carbon comes from
- What Is the Typical Carbon Payback Time?
- Worked Example: When Does a 400 W Solar Panel Pay Back Its Carbon?
- The assumptions behind this example
- Does Location Change the Carbon Payback?
- What Factors Make the Payback Shorter or Longer?
- What shortens the carbon payback
- What lengthens the carbon payback
- Can carbon payback be worse than financial payback?
- How Can Homeowners Estimate Their Own Carbon Payback?
- Carbon Payback vs Financial Payback: What’s the Difference?
- What Is the Carbon Payback of a Solar Panel? Key Takeaways
- Frequently Asked Questions
- How long does it take for a solar panel to pay back its carbon emissions?
- Does carbon payback mean a solar panel causes no emissions?
- Why can two solar panels have different carbon payback times?
- Does a solar panel need sunlight to reach its carbon payback point?
- Is a faster carbon payback always the better solar investment?
What Is the Carbon Payback of a Solar Panel?
Put simply, a panel has already emitted carbon by the time it is bolted to your roof. Carbon payback is the moment its cumulative generation has avoided enough grid electricity emissions to match that debt. After that moment the panel is a net carbon reducer for the rest of its working life.
The word “avoided” does a lot of work here. A panel generates clean electricity, but that electricity only displaces grid electricity if the grid would otherwise have produced it. On a grid running mostly on fossil fuels, a solar kilowatt-hour displaces a dirtier kilowatt-hour and repays the debt faster. On a grid that is already largely renewable, the same panel repays its debt more slowly, because it is displacing electricity that was not very dirty to begin with.
Published lifecycle assessments put the lifetime carbon footprint of a modern crystalline silicon panel at roughly 40 to 60 grams of CO2e per kilowatt-hour generated, and about 80 percent of that footprint is created in manufacturing. A typical residential system is therefore carbon-positive within a couple of years and stays that way across a 25 to 30 year working life.
Worth saying clearly, because it comes up constantly: solar is low carbon, not zero carbon. The emissions are front-loaded into the factory, which is precisely why the payback period is such a useful number to look at.
How Is the Carbon Payback of a Solar Panel Calculated?
The calculation is one division, and every input is something you can look up rather than take on trust.
Carbon payback (years) = embodied emissions of the system (kg CO2e) ÷ annual avoided emissions (kg CO2e per year)
Annual avoided emissions are themselves a simple product: the system’s yearly generation in kilowatt-hours multiplied by the grid carbon intensity it displaces, expressed in grams of CO2e per kilowatt-hour. Here is what each variable means and where it comes from.
What the formula needs from you
Embodied emissions cover the whole life of the hardware: raw material extraction, refining, module and inverter manufacture, the balance of system, transport to site, installation, and end-of-life treatment. Most modern datasheets or lifecycle assessments give this as grams of CO2e per watt or kilograms of CO2e per kilowatt of installed capacity.
Annual generation is your installed capacity in kilowatts multiplied by specific yield, the kilowatt-hours per kilowatt a system delivers in a year at your site after losses. A figure of roughly 1,000 to 1,400 kWh per kW per year covers a wide spread of residential locations, and your installer’s generation estimate will be more precise.
Grid carbon intensity is the average emissions of the electricity your panel displaces, in gCO2e per kWh. National grid operators and public emissions trackers publish these, and they vary enormously between countries and even between states.
Degradation and lifespan do not change the first year of the calculation, but they change the lifetime picture. Panels lose roughly 0.3 to 0.8 percent of output per year, so annual avoided emissions drift down slowly over three decades.
Where a panel’s embodied carbon comes from
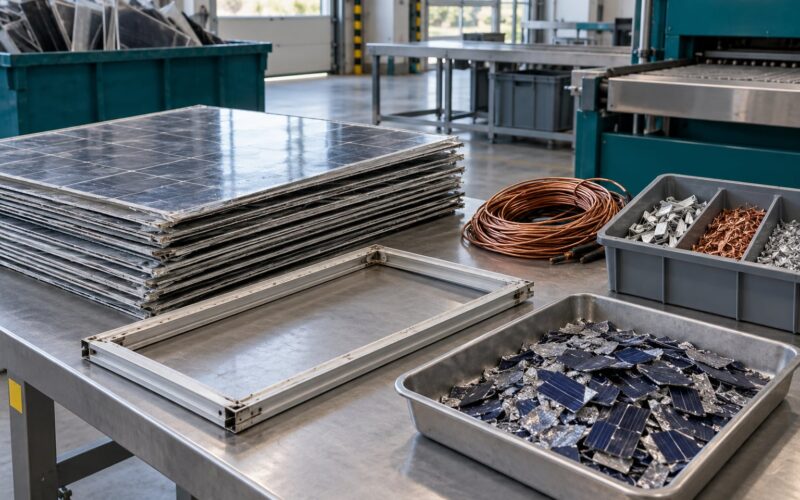
Around 80 percent of a module’s lifecycle carbon is locked in before it ships. Silicon purification dominates, running at temperatures above 1,400 degrees Celsius and consuming a large share of the factory’s energy. Cell manufacturing follows, then the glass, the aluminium frame and encapsulants, then mounting rails and cabling.
Transport and installation are small by comparison, and end-of-life recycling either offsets a portion of the original materials or adds a small residual load. The practical consequence is that the factory and the electricity it runs on matter far more than the delivery truck.
Because results depend on whose factory and whose grid you are looking at, published carbon payback figures are always ranges. Analysts publish system energy payback time ranges of one to four years for the same reason.
What Is the Typical Carbon Payback Time?
For a modern residential system on a moderately fossil-fuelled grid, the answer is about one to two years. That is the figure most lifecycle assessments converge on, and it has improved substantially: panels made a decade ago in coal-powered factories often needed three to five years to repay the same debt.
The range either side of that is where the interesting cases sit.
- Roughly 0.5 to 1 year: panels manufactured on a largely renewable-powered grid, generating on a site with high solar irradiance, displacing a grid running on coal or gas.
- About 1 to 2 years: the common case in North America, Europe and parts of Asia, with modules made on a mixed grid and a mixed local grid.
- About 3 to 4 years: modules manufactured in a coal-powered factory and installed somewhere with a coal-heavy grid, or installed on a low-yield, partly shaded roof.
- 5 years and beyond: the uncommon end, typically a low-irradiance site on a very clean grid. It does happen, and it is the reason a vendor quoting a single universal number without assumptions is worth questioning.
One peer-reviewed study of residential solar published in 2024 found carbon payback times of 0.5 to 1.2 years for a standard system, rising to 3.0 to 7.4 years in a higher-emissions scenario. That spread inside a single study is the honest picture of this number.
Worked Example: When Does a 400 W Solar Panel Pay Back Its Carbon?
These figures are illustrative, not a guarantee, and they exist to show the mechanics. Every real answer will use your own numbers.
The assumptions behind this example
A single 400 W module, installed with a basic inverter and mounting, on a roof with no shading. Specific yield of 1,100 kWh per kW per year after system losses, so annual generation is about 440 kWh. Embodied emissions of 300 kg CO2e for the module plus 60 kg CO2e for the inverter and mounting gives a total of 360 kg CO2e.
Annual avoided emissions work out to 440 kWh multiplied by the local grid intensity. Here is how the same panel performs against three different grids.
| Scenario | Grid carbon intensity | Annual avoided emissions | Carbon payback |
|---|---|---|---|
| Fossil-heavy grid, clean factory | 400 gCO2e per kWh | 176 kg CO2e | 360 ÷ 176 = about 2.0 years |
| Mixed grid, mixed factory | 250 gCO2e per kWh | 110 kg CO2e | 360 ÷ 110 = about 3.3 years |
| Very clean grid, clean factory | 50 gCO2e per kWh | 22 kg CO2e | 360 ÷ 22 = about 16 years |
Two things jump out. First, halving grid intensity doubles the payback, because it halves the avoided emissions. Second, payback is not a cliff edge: even the slow scenario reaches breakeven, and then keeps reducing emissions for twenty-five years or more afterwards.
If your own system is larger, scale both sides of the division. A 4 kW array at the same site conditions has roughly ten times the generation and roughly ten times the embodied emissions, so it lands close to the same payback as one panel, with a few extra percent from shared mounting and a larger inverter.
Does Location Change the Carbon Payback?
Location matters more than almost anything else you control, and it works through two separate levers that are easy to mix up.
The first lever is which electricity your panel displaces. A panel in a region whose grid runs on coal offsets far more emissions per kilowatt-hour than the same panel in a region already running on wind, hydro or nuclear. This is why the sunniest places are not automatically the fastest to repay carbon.
The second lever is how much you actually generate, which depends on solar irradiance, seasonal cloud cover, roof pitch and orientation, and how much shade the array picks up during the day. A well-oriented, unshaded array in a sunny inland site beats a shaded roof facing the wrong way, even in the same grid region.
Panel technology is a third, smaller lever. Higher module efficiency means more output from the same roof area, so fewer panels, less hardware and less embodied carbon per kilowatt-hour delivered.
There is one more location effect worth knowing, and it is frequently missed. If a country adds a lot of solar quickly, some of that midday generation may be exported or absorbed rather than displacing fossil plant at the same hour. Rapid deployment can stretch the real-world payback well beyond what the textbook calculation suggests.
What Factors Make the Payback Shorter or Longer?
What shortens the carbon payback
A dirtier local grid. More emissions per displaced kilowatt-hour means faster repayment, and this is usually the single biggest lever in the whole calculation.
Clean-powered manufacturing. A module made in a factory running on renewable electricity carries a much lighter embodied carbon load, sometimes less than half of a coal-powered equivalent.
Higher module efficiency. More watts per panel means more kilowatt-hours per unit of glass, aluminium and silicon.
Lower system losses. Inverter conversion losses, cable runs, dust and mismatch all shave the output, so a well-designed system repays faster than an identical but sloppily specified one.
Higher specific yield. Good solar resource, correct tilt and orientation, and no shading.
End-of-life recycling. Recovering aluminium, glass and silicon at the end of a panel’s life offsets part of the original material production.
What lengthens the carbon payback
A cleaner local grid. The uncomfortable truth is that the greener your electricity already is, the less a new solar panel changes the total.
Coal-powered manufacturing. Older polysilicon capacity in coal-heavy regions remains the most carbon-intensive way to make a panel.
Shading and poor orientation. Trees, chimneys, a north-facing pitch or a badly angled array cut generation directly, and generation is the numerator’s driver.
Longer degradation assumptions. If you model conservatively and assume output falls faster, the payback stretches accordingly.
Heavy operational consumption. Systems with frequent inverter replacement, or maintenance-intensive setups, add emissions that a simple panel-level calculation ignores.
Small or poorly planned systems. Fixed costs such as permitting and grid connection spread over very little generation lengthen the picture more than most buyers expect.
Can carbon payback be worse than financial payback?
Yes, and it is worth internalising because nobody warns you about it. Financial payback and carbon payback reward the same output for different reasons: money comes from the tariff you avoid paying, carbon comes from the grid emissions you avoid. On a cheap-electricity, low-carbon grid, a system can look financially attractive while repaying its embodied carbon slowly.
The reverse is just as possible. On an expensive, fossil-heavy grid, a mediocre system can pay back its carbon faster than a good one on a clean grid. The two numbers measure different things, so treat them separately.
How Can Homeowners Estimate Their Own Carbon Payback?
You can get a defensible estimate in five steps, and every input is publicly checkable.
1. Get the embodied emissions figure. Look for the manufacturer’s Environmental Product Declaration, or a third-party lifecycle assessment. Without one, published module figures usually sit in the low hundreds of kg CO2e per module for a modern residential panel. Add a rough allowance for the inverter and mounting.
2. Get your specific yield. Ask your installer for the annual generation estimate in kWh for your exact array, roof and shading. Anything in the 1,000 to 1,400 kWh per kW per year range is a sane ballpark to start from.
3. Find your grid carbon intensity. Your grid operator or national energy agency publishes this. If you can, use a time-of-use or marginal emissions figure as well, since that reflects what your panel actually displaces hour by hour.
4. Divide. Embodied kg CO2e divided by (annual kWh × kg CO2e per kWh) gives you years.
5. Sanity-check against the range. Anything under 1 year or over 5 years deserves a second look at your inputs. One of them is usually wrong, usually the grid intensity.
If you want to check a manufacturer’s carbon claims rather than a general figure, look for an Environmental Product Declaration that follows ISO 14067 or the EU Product Environmental Footprint method, and check the certification marks on the module rather than taking a summary claim at face value. Credible LCA language is treated as a genuine trust signal by the people who actually buy these systems; a bare marketing sentence is not.
For anything involving your roof structure, mounting, or the electrical connection itself, get a licensed installer involved. Electrical and structural work is not a DIY job, and the generation estimate they produce will be better than anything you can compute alone.
Carbon Payback vs Financial Payback: What’s the Difference?
Most pages ranking for this question answer a different question. Here is the distinction in one place, along with the companion term readers mix up most often.
| Energy payback (EPBT) | Carbon payback (CPBT) | Financial payback | |
|---|---|---|---|
| What it measures | When the panel’s lifetime output equals the energy used to make it | When lifetime output has offset the CO2e emitted in making it | When electricity savings cover the installed cost |
| Unit | Years | Years | Years |
| Typical residential range | About 1 to 4 years | About 1 to 2 years on a mixed grid, more on a clean one | About 6 to 12 years depending on tariff and incentives |
| Main driver | Solar resource and manufacturing energy intensity | Grid carbon intensity and embodied carbon | Electricity price, system cost, tariffs, incentives |
| Key sensitivity | Where and how the panel is made | Which grid the panel displaces | What you pay and what you save per kWh |
| Can the three disagree? | Yes | Yes | Yes |
Energy payback asks an energy question, carbon payback asks a climate question, and financial payback asks a money question. Panels made in a clean factory on a clean grid can post an excellent energy payback and a mediocre carbon payback. None of the three is wrong; they just answer different things.
What Is the Carbon Payback of a Solar Panel? Key Takeaways
The core finding is that a modern solar panel repays its embodied carbon in roughly one to two years on a typical grid, with a realistic spread from about six months to several years, and it goes on cutting emissions for the 25 to 30 years it works. Solar is one of the fastest options available for turning industrial production emissions into avoided grid emissions.
Your first action is simple: find your grid carbon intensity and multiply it by your array’s annual generation. That one number does more to predict your result than any general figure quoted by a vendor.
One correction to carry away, since it is the most common misunderstanding: carbon payback does not mean a solar panel produces no emissions over its life. It means the emissions front-loaded into manufacturing get repaid, and everything the panel generates afterwards is a net gain.
Frequently Asked Questions
How long does it take for a solar panel to pay back its carbon emissions?
Typically one to two years for a modern residential system on a moderately fossil-fuelled grid. The realistic spread runs from roughly six months for panels made and installed on clean, sunny grids to three years or more for coal-powered manufacturing sold into coal-heavy grids. After the payback point the panel reduces emissions for its whole working life.
Does carbon payback mean a solar panel causes no emissions?
No. Solar is low carbon, not zero carbon. Roughly 80 percent of a panel’s lifecycle emissions are created during manufacturing, mostly in silicon purification, and the rest comes from transport, installation and end-of-life treatment. Carbon payback means those front-loaded emissions get repaid by avoided grid electricity, after which the panel is a net carbon reducer.
Why can two solar panels have different carbon payback times?
Two variables dominate. The first is where the panel was made, since a factory running on coal or gas carries far more embodied carbon than one running on renewables. The second is which grid the panel displaces, because avoiding a dirty kilowatt-hour repays the debt far faster than avoiding a clean one. Sunlight, orientation, efficiency and shading shift the result further.
Does a solar panel need sunlight to reach its carbon payback point?
Yes, sunlight is the input that does the repaying. A shaded or badly oriented panel generates less, so the avoided emissions per year are smaller and the payback stretches out. The point of the payback period is that sunlight eventually arrives regardless of season or cloud cover, so any panel that generates at all still reaches the point eventually, just over a longer period.
Is a faster carbon payback always the better solar investment?
No. Carbon payback measures climate benefit; financial payback measures whether your money comes back. The cheapest system is not automatically the fastest on carbon, and the fastest on carbon is not automatically the cheapest. On a cheap, low-carbon grid a system can look financially attractive while repaying its embodied carbon slowly. Treat the two numbers as separate questions.
Reviewed for 2026. The numbers above reflect published lifecycle assessment ranges and the assumptions stated in the worked example; if you need a figure for your own roof, an installer’s generation estimate plus your grid operator’s emissions factor will get you closer than any generic answer.