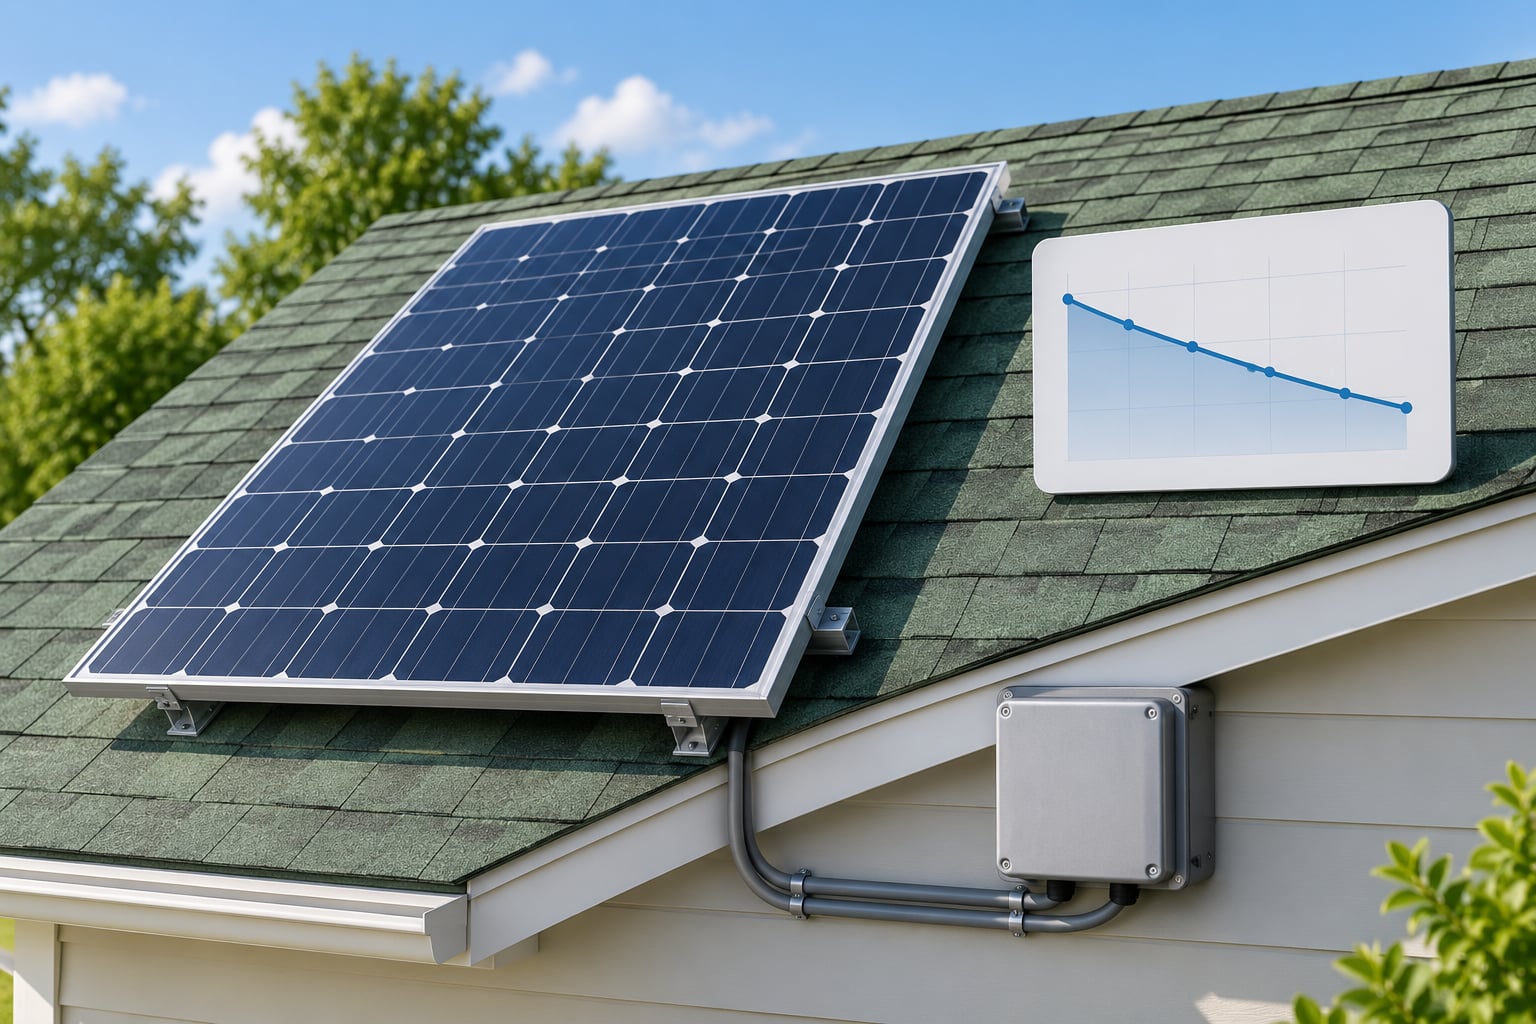
If you have ever looked at two years of production data from your own array and wondered whether the drop was real, panel degradation rate is the number that answers it. It is the percentage of a module’s rated power that it loses each year, measured against the nameplate rating, and for most modern residential panels it settles somewhere between 0.5% and 0.8% a year after a first-year drop of roughly 2% to 3%. Nothing about a panel wears out on a schedule you can watch from day to day. It fades slowly, in percentages small enough that weather usually hides them.
That is the first thing to get straight. A drop in monthly production is not automatically degradation. Cloud cover, a hot week, a dusty module, a shaded chimney and an inverter running hot will all change what your meter reads without a single cell being worse off.
Table of Contents
- What Is Panel Degradation Rate?
- How Is Solar Panel Degradation Measured?
- Module-Level Versus System-Level Degradation
- What Is a Normal Solar Panel Degradation Rate?
- The Three Phases of the Degradation Curve
- What Causes Panel Degradation Over Time?
- Light-Induced Degradation and LeTID
- Potential-Induced Degradation
- Microcracks, Hotspots and Mechanical Stress
- Ultraviolet Aging, Encapsulant Yellowing and Thermal Cycling
- What Is Not Degradation
- How Much Solar Output Should You Expect as the Panel Ages?
- How to Find Your Own Panel Degradation Rate
- How Can Homeowners Reduce Panel Degradation?
- What Should Homeowners Ask a Solar Installer?
- Frequently Asked Questions
- What is solar panel degradation?
- What is the average degradation rate of solar panels?
- How do I find my solar panel degradation rate?
- What is the 20% rule for solar panels?
- What is the 33% rule in solar panels?
- Why are people getting rid of solar panels?
What Is Panel Degradation Rate?
Panel degradation rate is the annual percentage decline in a solar panel’s maximum power output relative to its rated (nameplate) output. Most modern crystalline modules degrade at about 0.5% to 0.8% per year after an initial first-year drop of 1% to 3% caused by light-induced degradation. A panel with a degradation rate of 0.5% is still producing roughly 87% of its nameplate watts at year 25.
Degradation is permanent, cumulative and usually gradual. Once a cell’s output has fallen, it does not come back on its own. That is what separates it from a production loss, which is temporary and recoverable.
Temporary losses you can usually fix or wait out:
- Dust, pollen, bird droppings, algae and lichen on the glass
- Shading from a new tree, a building addition or a neighbour’s roof
- Heat, which lowers output for the duration of a hot spell and leaves no lasting mark
- Snow cover in winter, grid outages, and inverter clipping at peak
Permanent degradation you cannot undo:
- The year-one drop when the module first sees full sun
- Slow ultraviolet, thermal and moisture aging of the cell and its encapsulant
- Microcracks, corroded connections and hotspot damage
- Potential-induced degradation after a change to the system
How Is Solar Panel Degradation Measured?
Every measurement starts from the same reference point: the nameplate rating stamped on the module, measured at standard test conditions of 1000 watts per square metre of irradiance, 25 degrees Celsius cell temperature and an air mass of 1.5. Real conditions almost never match that, so a raw production number from your meter is not directly comparable to the label.
Temperature matters most in practice. A module’s power output falls as its cell temperature rises, and a rooftop can easily run 25 to 35 degrees Celsius above ambient on a clear afternoon. The temperature coefficient on the datasheet, usually somewhere around minus 0.3% to minus 0.4% per degree for a modern module, tells you how much of that gap is physics rather than aging.
Module-Level Versus System-Level Degradation
The number on a datasheet describes one panel in a test lab. Your array is a system of panels, wiring, an inverter, a meter and an installer, and the system as a whole usually loses more than the modules do. The gap comes from soiling, mismatch between panels, connector and cable losses, inverter efficiency, downtime and shading.
| Measure | Typical Annual Rate | What It Covers |
|---|---|---|
| Warranted rate on a datasheet | 0.45% to 0.55% | The contractual claim ceiling, tested under controlled conditions |
| Module-level, measured in the field | 0.5% to 0.9% | Panels only, under real mounting and weather |
| System-level, measured at the meter | 0.8% to 1.3% | Modules plus balance of system, soiling, availability |
| Plant with documented hotspot defects | Around 2% or higher | Modules carrying localised cell damage |
If you own an array, the third row is the one that describes your meter. That is not a defect. It is the ordinary difference between a component rating and a system result, and it is the number your savings actually depend on.
What Is a Normal Solar Panel Degradation Rate?
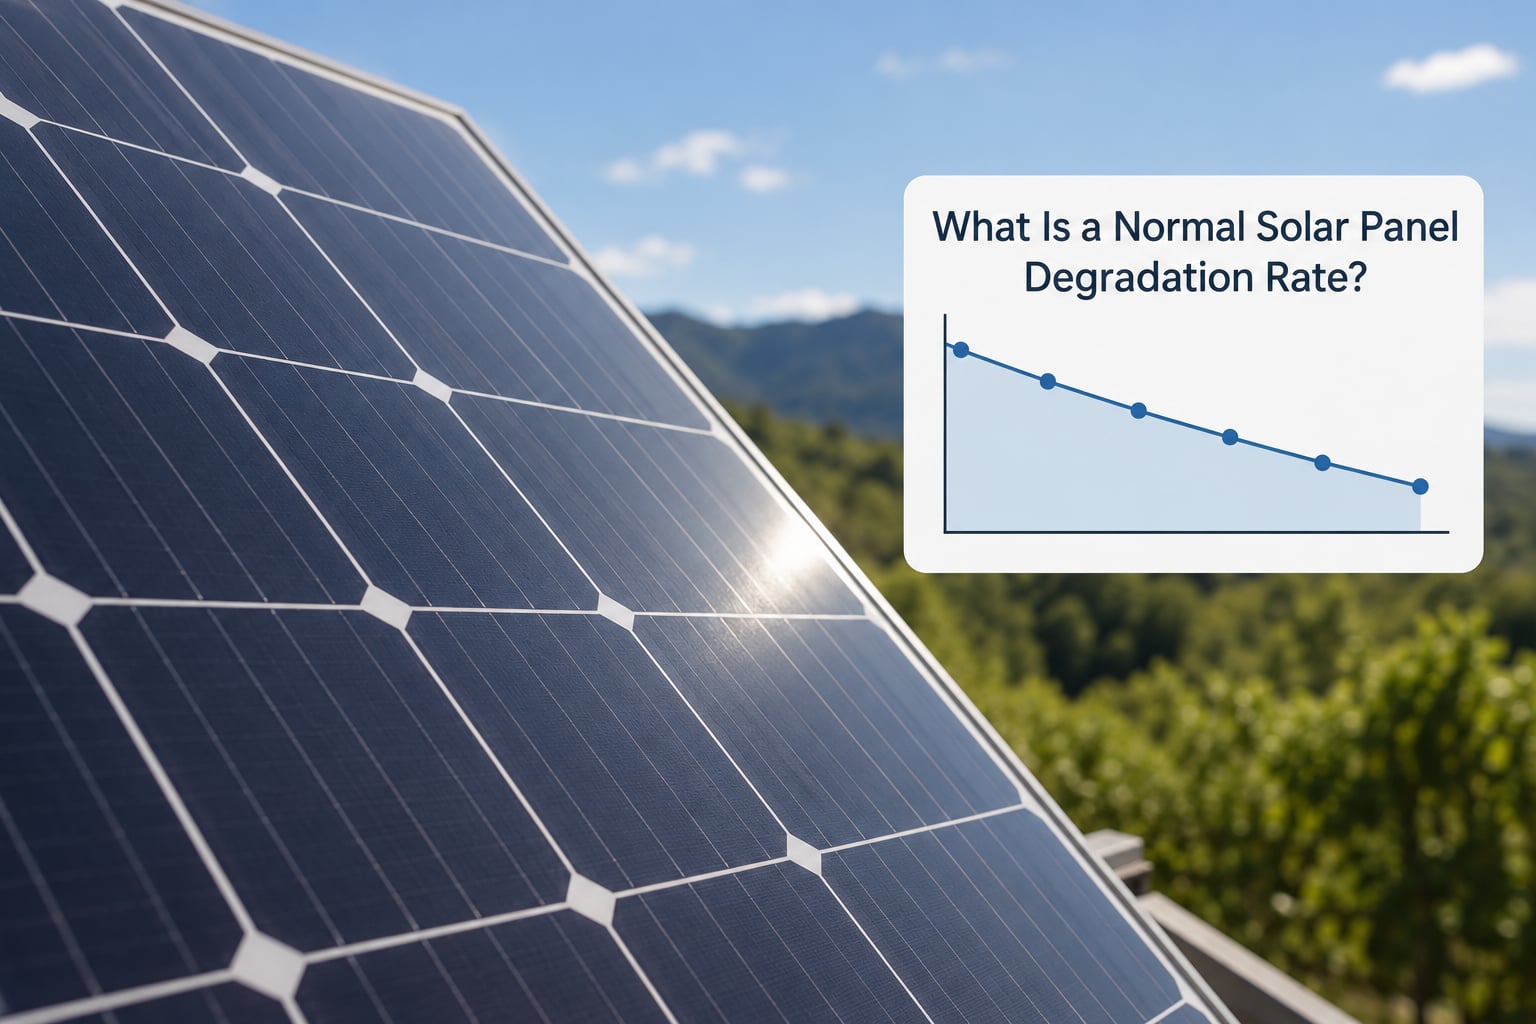
A normal solar panel degradation rate after the first year is somewhere between 0.3% and 1.0% annually. Tier-1 monocrystalline modules with 25-year performance warranties are usually warranted at 0.45% to 0.55% a year, and monitored field studies tend to land in the 0.5% to 0.9% band for healthy modules. Panels with older p-type PERC cells sometimes carry a higher warranted rate of around 0.8% because of the boron-oxygen defects that affect them.
Owners on solar forums consistently treat roughly 0.3% to 0.5% a year as the honest real-world figure once a system has been running a few years, and they draw a hard line between the first-year drop and everything after it. That split matters more than the average.
The Three Phases of the Degradation Curve
- Phase one, year one. Light-induced degradation (LID) takes 1% to 3% off as the module settles under its first exposure. On older p-type silicon it can reach 3% or more. N-type cells are markedly better here.
- Phase two, years 1 to 25. A slow, near-linear decline at the warranted rate, driven by ultraviolet exposure, thermal cycling and moisture.
- Phase three, past year 25. Losses often steepen slightly as the encapsulant browns, connections corrode and cells crack further.
Here is how a 6 kW array of 400 W modules looks at each point in life, starting from 98% of nameplate after the first year.
| Year | At 0.5% per year | At 0.8% per year | At 1.0% per year |
|---|---|---|---|
| 1 | 98.0% | 98.0% | 98.0% |
| 5 | 96.1% | 94.9% | 94.1% |
| 10 | 93.7% | 91.2% | 89.5% |
| 15 | 91.3% | 87.5% | 85.2% |
| 20 | 89.1% | 84.1% | 80.2% |
| 25 | 86.9% | 80.7% | 76.2% |
| 30 | 84.8% | 77.8% | 72.5% |
Read the 0.5% column against a typical 25-year warranty guarantee of 92% output and you will see most modules beating their own paperwork. Read the 1.0% column and you see the same array landing near 76%, which is why the gap between a well-warranted panel and a poorly-warranted one is worth asking about before you sign anything.
What Causes Panel Degradation Over Time?
Degradation comes from specific physical and chemical mechanisms, not from a vague idea of weather damage. Knowing which one is acting tells you whether it can be slowed.
Light-Induced Degradation and LeTID
Boron-oxygen complexes form in p-type silicon when the module first sees sunlight, pulling carriers out of the base and reducing current. That is LID, and it is why year one always costs something. Related effects called LeTID show up in certain cell types under partial illumination and high temperature, sometimes appearing only after a year of rooftop service. N-type silicon is largely immune to both, which is the main longevity argument for TOPCon, HJT and IBC modules.
Potential-Induced Degradation
PID happens when the module and its frame sit at different electrical potentials, usually because of high system voltage, poor grounding or humidity. Leaky insulation lets charge migrate into the cell surface, which lowers output and can recover if the cause is removed. It shows up in residential systems after an inverter swap or a grounding change, which is exactly the scenario owners on r/solar and diysolarforum worry about most.
Microcracks, Hotspots and Mechanical Stress
A microcrack is a hairline fracture in the cell. On its own it costs very little. The problem is what follows: a cracked cell can send current through a small area of itself under load, heating that spot until the cell is dead. That band of dead or throttled cells is what people mean by a hotspot. Wind, hail, a worker stepping on a panel and the flex that happens every time a roof expands and contracts all feed this category. Arrays with documented hotspot defects have been measured degrading at roughly 2% a year against about 1.2% for healthy peers.
Ultraviolet Aging, Encapsulant Yellowing and Thermal Cycling
The clear polymer that bonds and protects the cell yellows under years of ultraviolet exposure, and it stops passing light as it discolours. Behind it, the polymer backsheet or glass laminate expands and contracts with every day-to-night swing. Thousands of those cycles stress solder joints, ribbons and the cell-stack bond. Coastal and humid air adds salt and moisture, so the same panel lasts longer inland than it does within a mile of surf.
What Is Not Degradation
Soiling is the big one. Dust, bird droppings and algae can cut output by 5% to 10% and owners routinely assume the panel is dying. It is not. It sits on the glass, and it washes or wipes off. A shaded string produces less power permanently in the sense that it will always produce less, but nothing is degrading. Heat is also temporary: output comes back when the module cools.
How Much Solar Output Should You Expect as the Panel Ages?
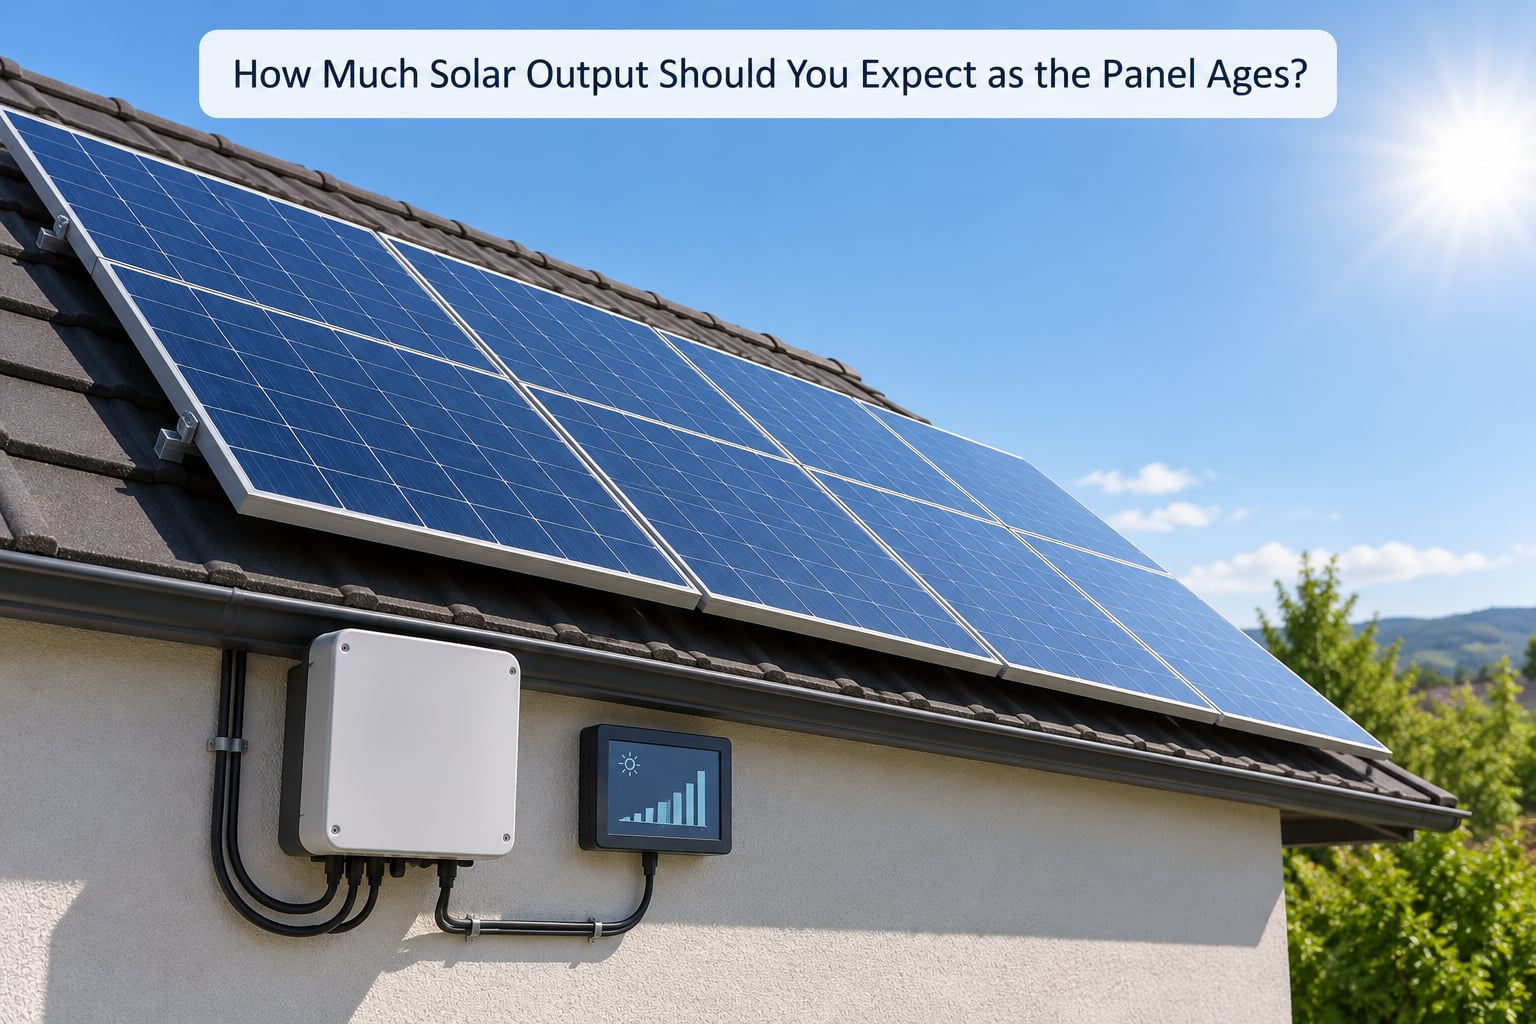
The calculation is simple once you have a clean baseline. Annual degradation percentage equals 100 times the difference between the previous year’s kilowatt-hours and the current year’s, divided by the previous year’s kilowatt-hours.
Take a residential system that produced 8,400 kWh in year one. At a 0.5% annual rate, year 25 works out to roughly 7,450 kWh. At 1.0%, the same system lands near 6,530 kWh. That is about 900 kWh a year you never generate at the meter, every year, for a quarter century.
How to Find Your Own Panel Degradation Rate
Four steps, and the first one is the one people skip.
- Pick a clean baseline. Use a full year of production from your monitoring portal, ideally a year with no major shading changes, no extended outages and no system work.
- Get the original expected output. Your installer should have given you a production estimate expressed in kWh per year for your site. If you cannot find it, the inverter datasheet plus your array size gives you a rough kW figure to work from.
- Compare two full years, three years apart, not one. Year-to-year differences are dominated by weather. Sunnier or cloudier seasons alone can move a single year by 10% and swamp a 0.5% signal.
- Normalise for weather before you conclude. Check your resource against a nearby reference site or a satellite irradiance estimate for the same months. If year two was genuinely cloudier, adjust for that before dividing.
If you want a professional answer rather than a self-check, an infrared thermography survey finds hotspots and electroluminescence imaging finds the cell cracks behind them. Both are quick on a residential roof and both turn a vague suspicion into evidence you can act on.
Two diagnostics worth knowing by name. The performance ratio, or PR, compares actual energy to the energy the array should produce from the sunlight that actually arrived. The performance loss rate, or PLR, tracks how far that PR has fallen since commissioning. For a healthy residential array, a PLR above roughly 1% to 1.5% a year, a sudden 10% to 30% step loss in one string, or a visible band of warm cells on a thermal image are all reasons to call someone out rather than wait.
How Can Homeowners Reduce Panel Degradation?
You cannot stop the chemistry. You can avoid the avoidable losses, and many of the biggest jumps in output come from fixing things that were never degradation in the first place.
- Get the mounting and ventilation right. Stand-off rails that hold the glass off the roof let air circulate behind the panel and shed heat. Direct-mounted panels run hotter and age faster.
- Set a cleaning cadence. In dusty or tree-adjacent sites, an annual wash in spring usually recovers a few percent. Look for buildup on the lower edge first, where dirt collects and hardens.
- Turn on monitoring and set alarms. Free portal alerts catch an underperforming string in weeks rather than years. Owners report that comparing portal output against expectation is what finally separated soiling losses from real aging for them.
- Inspect once a year. Look for cracked glass, discoloration, a loose junction box, a chewed cable or a panel sitting proud of the mounting. A thermal check in full sun finds the invisible ones.
- Replace at string level, not array level. One failing module in a string drags the whole string down through its bypass diodes. Swapping a single panel or two restores most of the loss for a fraction of a full replacement.
What Should Homeowners Ask a Solar Installer?
Ask these before signing, and ask them in writing. The answers are cheap to give and hard to get later.
- What is the warranted annual degradation rate on the exact module you are being quoted, and what output percentage does the 25-year warranty guarantee at year 25?
- Is the module PERC, N-type TOPCon, HJT, IBC or bifacial, and what does that mean for first-year LID on this site?
- Has the module been tested for PID resistance, and under what standard?
- What is the power temperature coefficient, and how are the modules mounted with respect to roof ventilation?
- What monitoring is included, who sets the alert thresholds, and who responds when one fires?
- Who handles a warranty claim, and what is the replacement process and timeline if a string underperforms?
- What happens to the warranty if I re-roof, if I replace the inverter, or if I sell the house?
The last question gets skipped most often. Warranties transfer with the property on most modern panels, but the workmanship warranty and the monitoring account do not always follow the same path.
Frequently Asked Questions
What is solar panel degradation?
Solar panel degradation is the gradual, permanent loss of a module’s power output over time. It happens first as light-induced degradation in year one, usually 1% to 3%, then continues as a slower decline of roughly 0.3% to 1% a year from ultraviolet exposure, heat cycling, moisture and mechanical wear. It is different from soiling or shading, which cut production temporarily and can often be reversed.
What is the average degradation rate of solar panels?
After the first year, most modern monocrystalline panels lose about 0.5% to 0.8% of their output annually. Warrantied rates on datasheets are usually 0.45% to 0.55%, and measured field results sit a little higher at 0.5% to 0.9% for the module and closer to 0.8% to 1.3% for a whole system including inverter and wiring losses.
How do I find my solar panel degradation rate?
Take a full year of production from your monitoring portal as a baseline, find the expected annual output your installer quoted, and compare two full years at least three years apart. Divide the difference in kilowatt-hours by the earlier year’s total and multiply by 100. Compare years rather than months, and correct for unusually cloudy or unusually sunny weather first, since weather swings swamp a 0.5% signal in a single year.
What is the 20% rule for solar panels?
The 20% rule is a myth in the form people repeat online. Panels are not designed to lose 20% of their output in 20 years. A healthy array losing 0.5% a year keeps about 87% of nameplate output at year 25, and the 0.8% to 1.3% loss people cite usually describes the whole system rather than the panels themselves.
What is the 33% rule in solar panels?
The 33% rule refers to an idea that a solar panel must retain 33% of its original output to break even on its purchase cost. Homeowner-installed panels have no purchase cost to recover, so the rule does not apply to them. It is a useful idea only for someone comparing an energy-return-on-investment calculation, and it says nothing about whether a panel is degrading abnormally.
Why are people getting rid of solar panels?
Removal usually has nothing to do with degradation rate. The common reasons are a full roof replacement that forces removal and refitting, a planned move where the new buyer does not want the system, a lease or power purchase agreement ending, or serious damage from a storm, hail or a fallen tree. Panels installed in the 1990s are often still generating, so age alone is rarely the trigger.
Start with the number your installer guaranteed and the number your meter shows, then compare them over two full years rather than one month. If the gap works out to a panel degradation rate above a percentage point a year, check the string-level output in your monitoring portal before anything else, and rule out soiling, because dirty panels are the most common cause of a sudden apparent drop and the cheapest to fix.