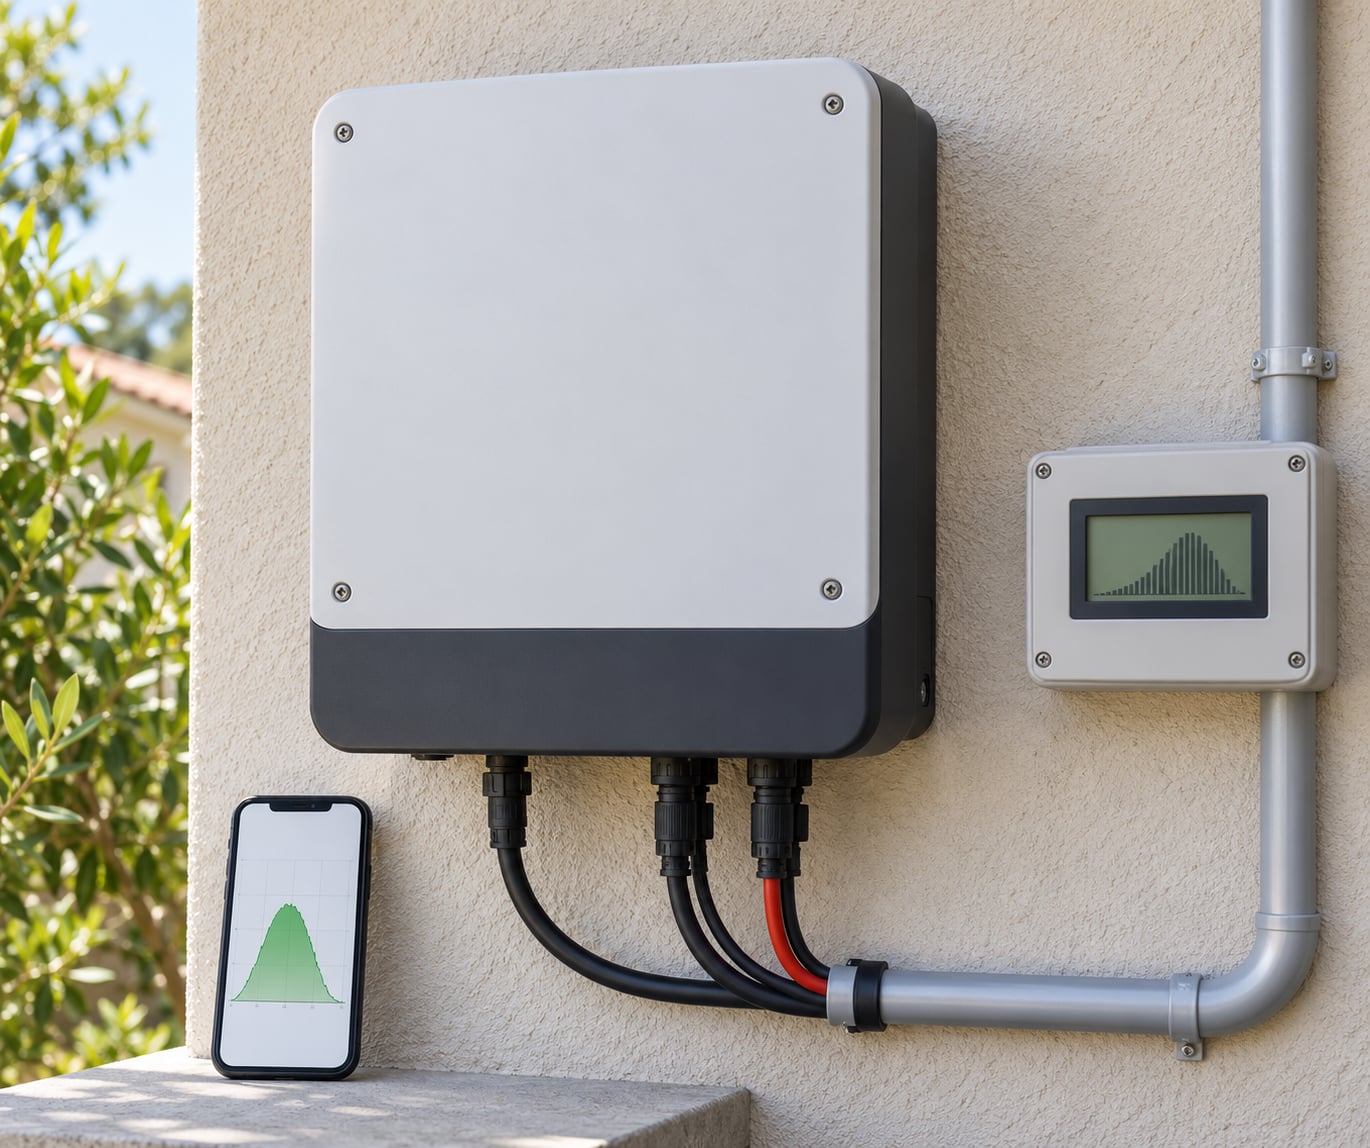
To monitor solar panel production you read the numbers your inverter already collects: the monitoring app that came with it shows live watts, today’s kilowatt-hours, and months of history, and the inverter’s own lights or display give you a rough reading when there is no app. Most systems need ten minutes of setup and about two minutes a week to stay ahead of faults.
Panels rarely die all at once. They lose output gradually through dust, a tree that grew two feet taller, a loose connection, or an inverter that throws an error code nobody reads. A 10 to 25 percent drop that goes unnoticed for a year is real money you never get back.
Below is the process I walk every new solar owner through, in the order that saves the most time.
Table of Contents
- What You Need
- The inverter, and what kind it is
- A working monitoring login
- Your system size in watts or kilowatts
- A phone or laptop on the same Wi-Fi as the inverter
- A place to record daily numbers
- The manufacturer’s instructions
- Step-by-Step: How to Monitor Solar Panel Production
- Step 1: Identify Your Solar System and Inverter
- Step 2: Check Current Solar Panel Production
- Step 3: Record Daily Energy Production
- Step 4: Compare Production Over Time
- Step 5: Investigate Warning Signs and Faults
- Step 6: Set Up Ongoing Monitoring and Alerts
- Common Mistakes
- Frequently Asked Questions
- What is the easiest way to monitor solar panel production?
- Should I use the inverter display, a mobile app, or my utility meter?
- How much solar energy should my panels produce per day?
- Why is my solar production lower on cloudy days?
- What does it mean if solar production suddenly drops?
- How often should I check and record my solar output?
- Conclusion
What You Need
You need very little. Gather these five things before you start and the whole job takes an afternoon.
The inverter, and what kind it is
Every solar system has an inverter or a set of microinverters, usually on a garage wall, in a basement, or on an exterior wall near the meter. The label tells you the brand and model. String inverters, microinverters, and DC power optimizers all report to a different app, so knowing which one you own saves you an hour of wrong downloads.
A working monitoring login
Your installer should have registered the system with the manufacturer and handed you an email and password. If you never got one, that is the single most common reason owners cannot monitor their panels. Write the credentials down somewhere outside your head, because losing them can orphan years of history.
Your system size in watts or kilowatts
Find the nameplate capacity on the inverter or on the panels. A 6 kW system and a 10 kW system cannot produce the same daily number, and without the capacity you cannot tell a normal day from a bad one.
A phone or laptop on the same Wi-Fi as the inverter
Most inverters connect to a 2.4 GHz network. Newer routers split 2.4 and 5 GHz into separate bands, and that split is the most common setup failure. Have the Wi-Fi password handy.
A place to record daily numbers
A spreadsheet, a notebook, or a notes app works. The value comes from the record, not the tool. Owners on r/solarenergy and DIY Solar Forum are split on this: half keep a spreadsheet for three years, half stopped checking entirely once the novelty wore off.
The manufacturer’s instructions
Error code meanings differ by brand. Keep the manual or the support page bookmarked rather than guessing from a forum post.
Step-by-Step: How to Monitor Solar Panel Production
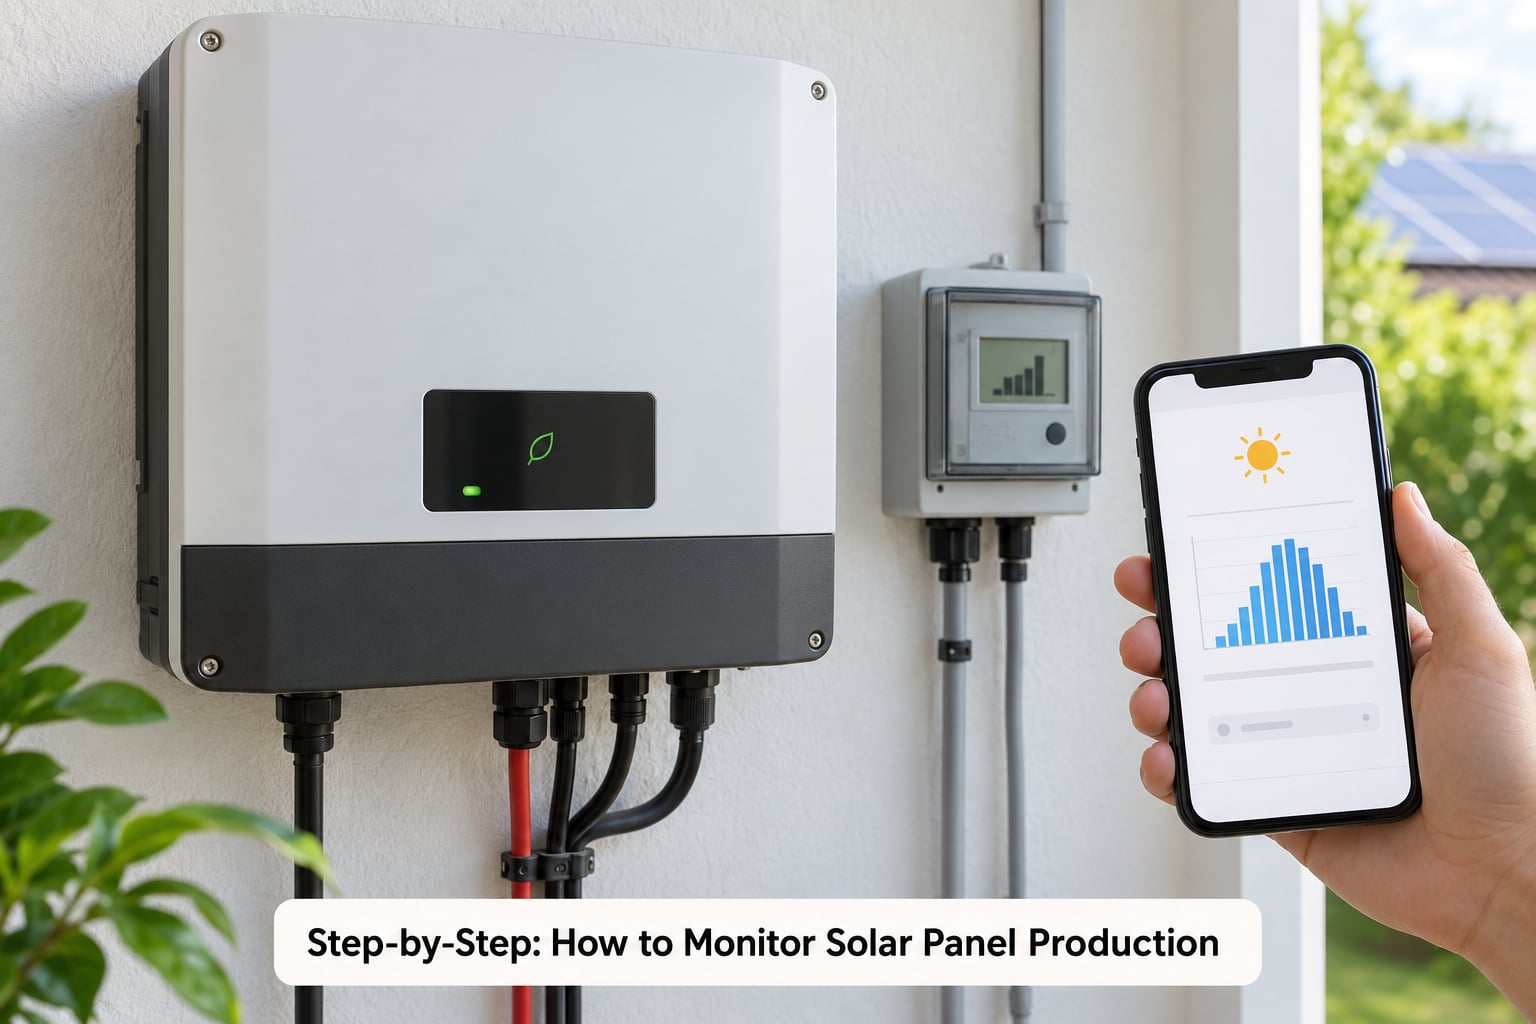
These six steps work whether you own panels with microinverters, optimizers, or one central string inverter.
Step 1: Identify Your Solar System and Inverter
Walk to the inverter and photograph the label. You are looking for the manufacturer, the model number, the rated capacity in watts, and a serial number. Write all four down, plus the installation date if the paperwork exists.
Next, find the monitoring portal. Enphase systems run through the Enphase Enlighten app, SolarEdge through the SolarEdge app or web portal, SMA through Sunny Portal, and Tesla Powerwall owners see their system inside the Tesla app. Generic string inverters usually point at the manufacturer’s own portal or at a data logger’s page.
If the app asks for a system ID or a “gateway serial,” that number is usually on the same label or on the monitoring device itself, which is often a small white box mounted next to the inverter.
Step 2: Check Current Solar Panel Production
Most monitoring screens show three different numbers, and confusing them is the most common beginner mistake. Instantaneous power in watts tells you what the panels are doing right now. Today’s energy in kilowatt-hours tells you what they have produced since sunrise. Lifetime energy is the running total since commissioning.
On a clear summer afternoon, a 6 kW residential system should show somewhere around 4 to 5 kW at solar noon, then fall away toward evening. If you want to monitor solar panel output at a glance, the today’s-kWh figure is the one to write down, because it is the number you can compare tomorrow.
Does a 400W solar panel produce 400W? Only under standard test conditions, which means cool cells at 25°C under 1000 W/m² of irradiance. On a hot July afternoon, a 400W panel commonly pushes 340 to 360W because cell temperature rises. A wattage far below that on a clear day is worth investigating; a wattage slightly below it is not.
Step 3: Record Daily Energy Production
Pick a fixed time to read the number, and do not move it. Mid-evening works well because the day’s production has finished but the inverter has not switched to standby. Some screens reset at midnight, so read after that.
Log the date, the daily kWh, and the weather in one line. Owners who keep a running log report that the habit is the entire value: the first time a real fault appears, the record is what proves it.
Keep production separate from consumption. Your inverter reports what the panels made. Your utility meter reports what moved across the grid in each direction. Those are different measurements and confusing them is why so many owners think their system has failed.
Step 4: Compare Production Over Time
Compare like with like: same time of day, similar weather, similar season. One flat day tells you nothing, which is why forum threads full of panicked screenshots usually turn out to be a cloudy Tuesday.
Season swings are large and completely normal. A residential system in a temperate climate can run 40 to 60 percent lower in December than in June, purely from sun angle and shorter days. What you are hunting for is a change that persists across several comparable days rather than a single dip.
Two benchmarks help you judge absolute performance rather than relative change. Specific yield, measured in kWh per kWp per year, runs around 1,600 to 1,800 in the sunny Central Valley of California and closer to 1,000 to 1,300 in cloudier regions. A performance ratio above roughly 80 percent is healthy; below 70 percent for a sustained period suggests a real problem worth raising.
Step 5: Investigate Warning Signs and Faults
Start with the lights on the inverter. A steady green or blue status light usually means normal operation. A blinking or red light, or a light that is off during full sun, is a fault indicator. Check the app first, since it usually names the fault in plain language rather than a bare code.
Work through the common causes in order of likelihood.
- Shading. A tree, a new shed, or a neighbour’s roof extension cuts a string inverter’s output hard. Panel-level hardware shows you exactly which panel is affected; a plain string inverter only shows that the total dropped.
- Soiling. Dust, pollen, bird droppings, and even a light film of snow reduce output steadily. In dusty regions an annual rinse is often enough; in areas with trees, expect more frequent cleaning.
- Inverter fault. Error codes for overvoltage, ground faults, and grid events all live in the manual. Record the code and the date before you reset anything.
- Connections. Corroded connectors and loose DC runs show up as intermittent drops, often only in heat or damp weather. This is electrician work, not homeowner work.
- Degradation. Panels lose roughly 0.5 to 0.8 percent of output per year. Over a 25-year life that is a normal, expected decline, not a fault.
Do not open the inverter, touch DC cabling, or climb on the roof to investigate. Everything above the level of “look at the screen” belongs to a licensed installer. If a fault persists through a reset and a clear day, take screenshots of the error and the production graph, then call your installer with the dates.
Step 6: Set Up Ongoing Monitoring and Alerts
Turn on notifications before you forget anything. Most platforms can email or push a message when the inverter reports a fault, when the system produces well below what the local weather predicts, or when the monitoring device stops reporting entirely. A comms failure is itself useful information.
Then set a cadence that survives contact with real life. Check daily for the first month, weekly after that, and monthly once you know your system’s shape. Forum owners are blunt about this: the honest answer is that after the first summer, daily checking stops being informative.
Two situations deserve extra setup. On an export-limited or zero-export system, the export meter reads near zero by design, so judge the system by production and self-consumption, not by what goes to the grid. If your installer holds the only account, get your own access in writing, along with a copy of your system’s commissioning report, because those reports carry the baseline numbers you need later.
Common Mistakes
- Checking only at midday. Midday numbers look healthy even on a failing system. Daily totals and multi-day trends catch what a snapshot misses.
- Comparing kilowatts to kilowatt-hours. Watts are instantaneous power; kWh is energy accumulated over time. Mixing them makes a system look broken or excellent when neither is true.
- Expecting identical output on cloudy days. Output tracks irradiance. A dull week is weather, not damage.
- Ignoring seasonal change. Winter output running 40 to 60 percent below summer is arithmetic, not a fault.
- Treating the electricity bill as a production meter. Bills show grid import and export. On an export-limited system, export can read near zero while the panels are producing perfectly.
- Deleting the history. Screenshots and monthly reports are the evidence you need for a warranty claim, and some manufacturer platforms retire old data.
- Panicking over a single error. Note the code, check the app’s own guidance, and see whether the fault clears on a clear day before escalating.
If your inverter app has gone missing or was discontinued, a clamp-style energy monitor such as a Shelly 3EM reads whole-home consumption and grid export independently of the vendor. Home Assistant can pull inverter data into a dashboard, and Raspberry Pi builds with EmonCMS do the same for people who would rather not rely on a cloud account at all. Privacy-minded and off-grid owners generally use one of these instead.
Frequently Asked Questions
What is the easiest way to monitor solar panel production?
The easiest route is the monitoring app that shipped with your inverter. It needs a Wi-Fi connection and the login your installer created, then it shows live watts, today’s kilowatt-hours, monthly history, and fault alerts without any extra hardware. If you do not have that login, start with the inverter’s status light and contact the installer for account access.
Should I use the inverter display, a mobile app, or my utility meter?
Use the app for anything involving history or diagnosis, because it keeps months of data and names the fault. The inverter display is a quick health check and works with no internet or phone. The utility meter shows grid import and export, which is useful for confirming savings but tells you almost nothing about what the panels produced.
How much solar energy should my panels produce per day?
Multiply your system’s capacity in kilowatts by roughly 3 to 5 kWh for a good day, then adjust for season and weather. A 6 kW system commonly lands between 18 and 30 kWh on a clear summer day and far less in winter. Your own first clear month’s average is the better benchmark, since orientation and shading change everything.
Why is my solar production lower on cloudy days?
Panels convert light, not heat or temperature, so output tracks how much sunlight actually reaches the cells. Under cloud the number drops hard, and after a passing storm it usually recovers within an hour. Sustained lower output across several clear days is a different story and points at shading, soiling, or a hardware fault rather than the sky.
What does it mean if solar production suddenly drops?
A sudden drop usually means shading, a new obstruction, heavy soiling, or an inverter fault, and the app will usually name which one. Check whether the drop persists on a clear day before doing anything else. If it does, record the daily kWh and any error code with dates, then contact your installer rather than opening equipment yourself.
How often should I check and record my solar output?
Check daily for the first month so you learn your system’s shape, then weekly, then monthly once the pattern is familiar. Most owners settle into a monthly review after the first summer. Keep monthly reports or screenshots, because some manufacturer platforms retire older history and you will want the record if you ever make a warranty claim.
Conclusion
Open the app your installer registered today and write down today’s kilowatt-hours. Do the same for seven days, note the weather, and that week becomes your baseline instead of a guess borrowed from someone else’s roof.
If a reading looks wrong, wait for the next clear day before you worry. If the low number comes back, save the screenshots and let your installer look at it. Ten minutes now is cheaper than a year of quietly underperforming panels.