If you’re wondering why is my solar production lower than expected, the short answer is that most systems are not broken. Heat on a bright day, shade hitting part of the roof, a layer of dust, seasonal sun angle, normal panel wear, or a billing and export setup that hides what your array actually made will all do it. A real hardware fault is the least likely explanation, and it’s the easiest one to rule out.
I’ve read a lot of owner threads on solar forums, and the same handful of causes keep coming up again and again. The ones that need actual work are rarer than people think.
Table of Contents
- Why Is My Solar Production Lower Than Expected?
- Solar Production vs. Solar Generation vs. Self-Consumption
- What Are the Most Common Causes of Low Solar Output?
- 1. Heat Losses on Clear, Bright Days
- 2. Shading From Trees, Buildings, and New Construction
- 3. Soiling: Dust, Pollen, Ash, Snow and Bird Droppings
- 4. Normal Panel Degradation
- 5. Inverter, Wiring, and Connection Faults
- 6. Inverter Clipping and Export Limits
- 7. Monitoring and Communication Dropouts
- How Much Solar Production Should You Expect?
- How Do You Check Whether the Problem Is Shading, Weather, or Equipment?
- 1. Compare Several Days, Not One
- 2. Check the Weather Record for Your Area
- 3. Read the Production Graph, Not Just the Number
- 4. Look for Per-Panel or Per-Mount Data
- 5. Check Inverter and Meter Notices
- 6. Compare Generation Against Consumption and Export
- 7. Decide From the Pattern
- What Should You Do When Solar Production Drops Suddenly?
- When Is Low Solar Production a Normal Seasonal Change?
- Frequently Asked Questions
- Why is my solar production lower on cloudy days?
- How much solar production should I expect in winter?
- Does tree shading permanently reduce solar panel output?
- Why does my solar system show low production but no inverter error?
- Is it normal for solar production to decline each year?
- Conclusion
Why Is My Solar Production Lower Than Expected?
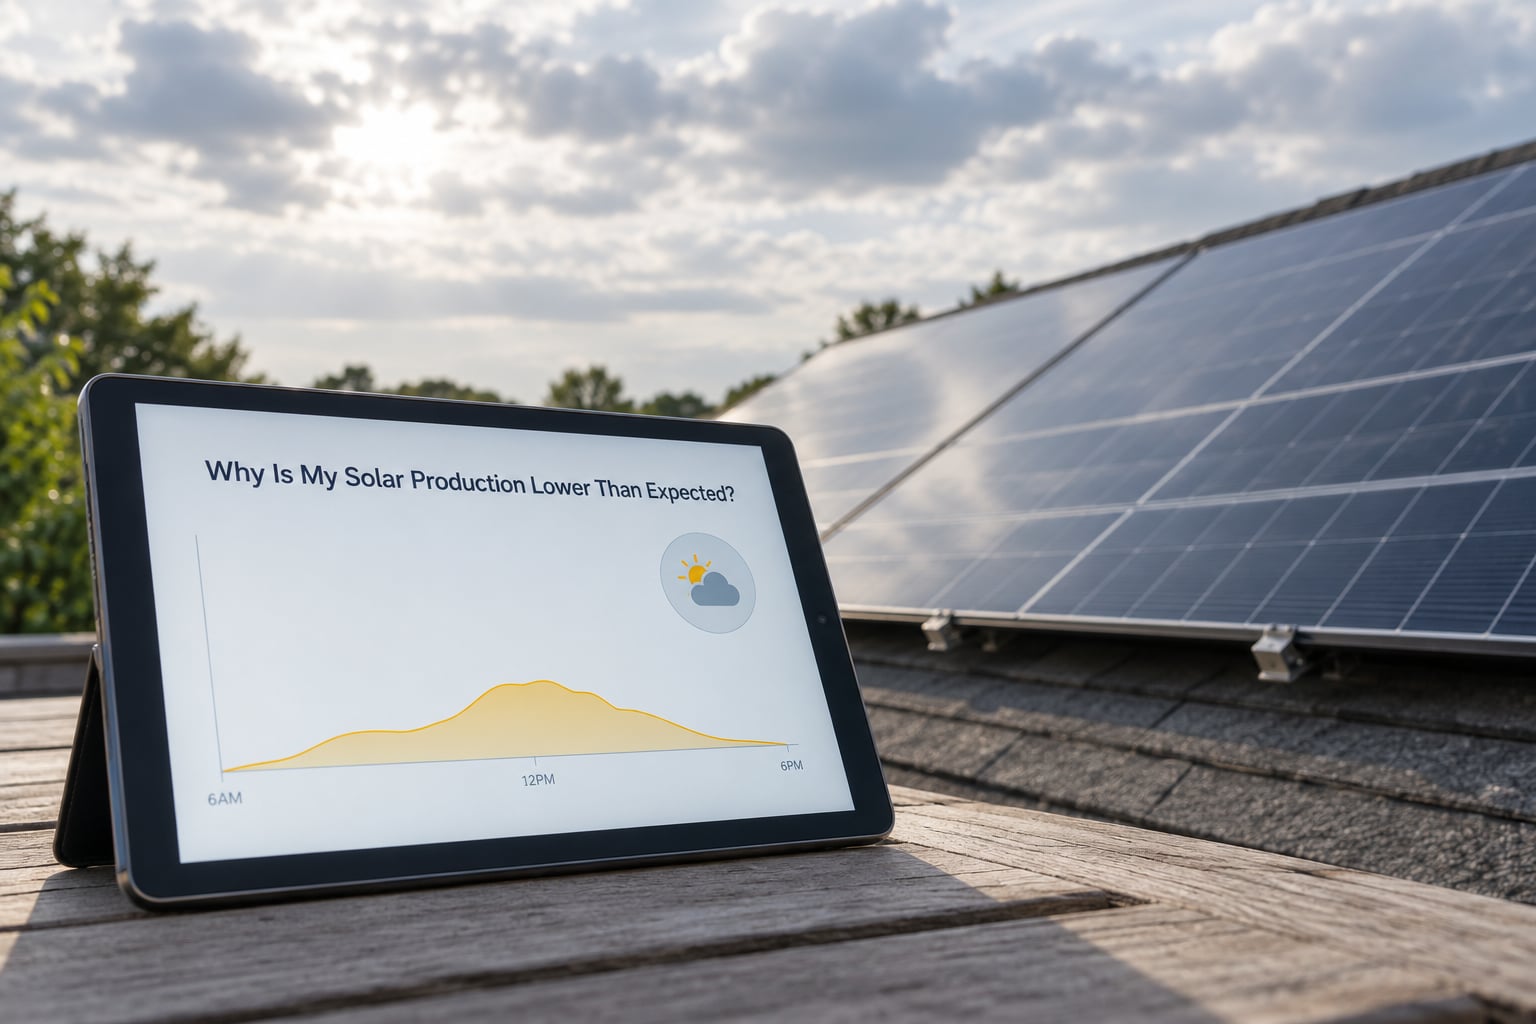
Solar production is lower than expected most often because the number you are comparing against came from a model, not from your roof. Sales estimates assume a specific peak sun hours figure, a tilt, an orientation, and a shading assumption, and real roofs rarely match all of those perfectly. Add normal annual panel wear and you have a system that is performing exactly as designed while looking 10 to 20 percent short of the number on the sales sheet.
The second most common reason has nothing to do with the panels at all: the bill, the export reading, or the app is showing you something other than raw generation. Export credits, battery charging, and daytime household use all change the number you see without any change in what the array produced.
Solar Production vs. Solar Generation vs. Self-Consumption
These three figures get mixed up constantly, and mixing them up is what sends people down the fault-hunt rabbit hole.
Solar generation is everything your panels turned into electricity, whether it went into the house, into a battery, or out to the grid. Solar production usually means the same thing, though some utilities use it loosely for what lands on the meter. Self-consumption is only the slice the house used directly while the sun was up.
On a clear June day a 7 kW array might generate 38 kWh while your home consumes 14, sends 18 to a battery, and exports 6. If your app defaults to showing self-consumption or export credits rather than generation, a healthy system can look terrible.
What Are the Most Common Causes of Low Solar Output?
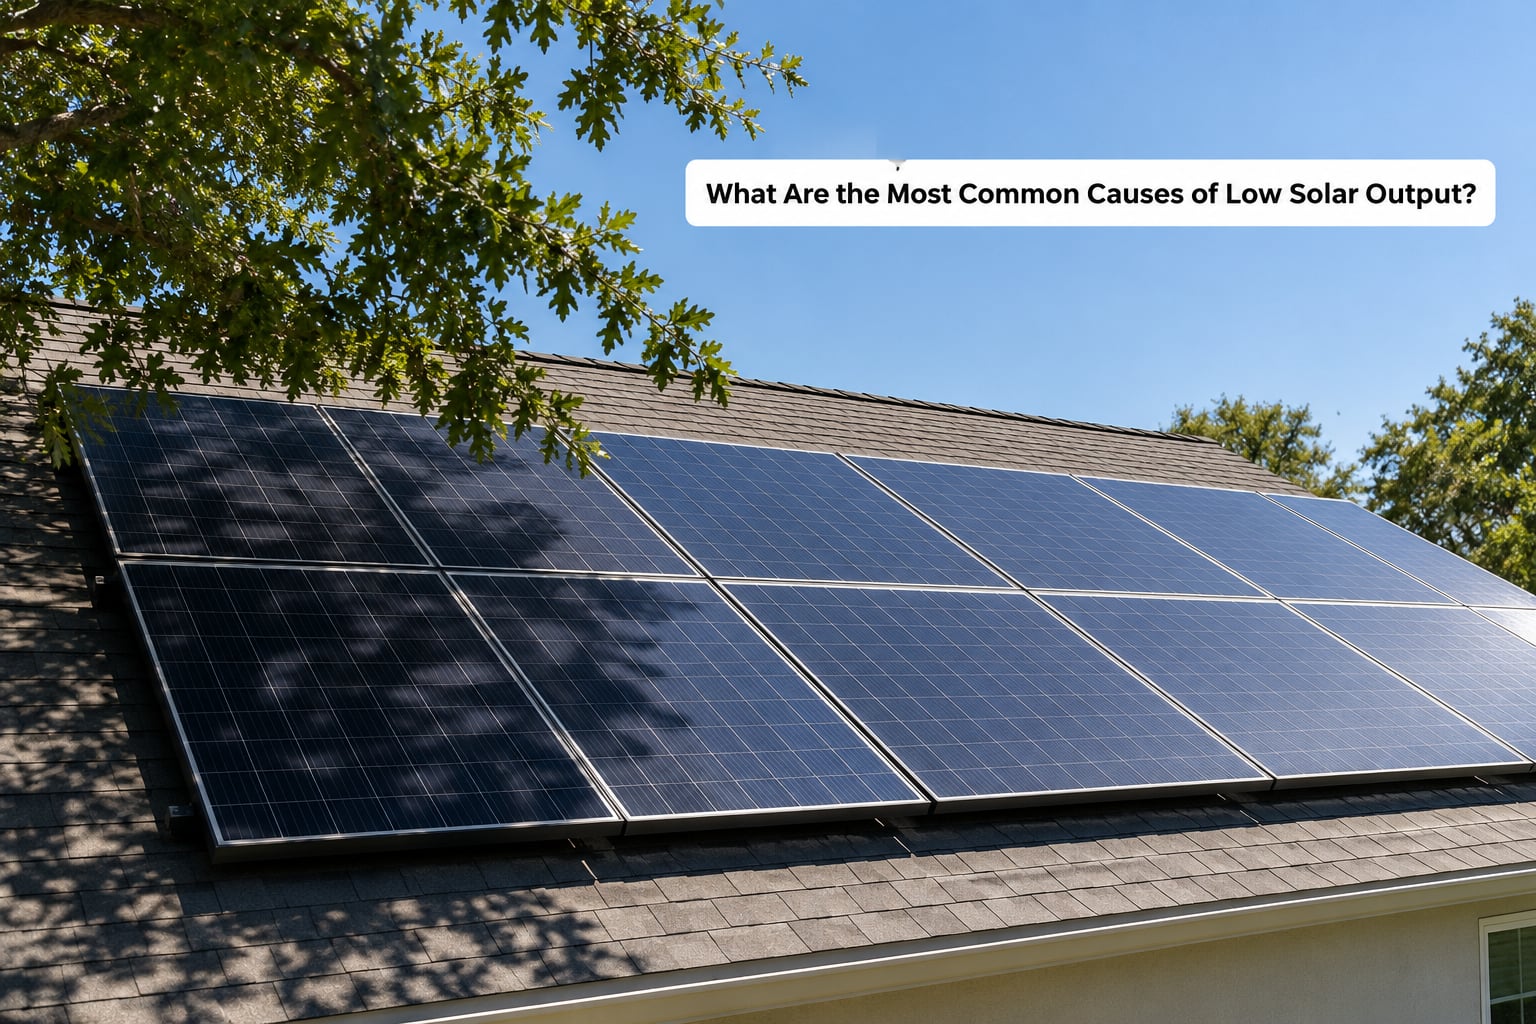
Ranked by how often each one turns out to be the real cause on a residential system.
1. Heat Losses on Clear, Bright Days
Panels are rated at about 25 degrees Celsius under laboratory conditions. On a summer afternoon a panel can run 25 to 30 degrees above that air temperature, and every degree above the rating point costs roughly half a percent of output. A 7 kW system can lose 1 to 1.5 kW of potential at peak heat.
This is the single biggest source of homeowner confusion, because it looks like a fault when the weather is nicest. Forum users consistently report that a hot sunny afternoon with weaker output than a mild one is completely normal.
2. Shading From Trees, Buildings, and New Construction
Shade is worse than most people expect because it hits the whole string, not just the shaded panel. A single shaded panel pulls its bypass diodes into play, and on a series string that can drag down the output of every panel in the run. On a microinverter setup the penalty is smaller but still real.
Trees also change year to year. Neighbours trimming a canopy, or a sapling maturing, quietly reduces production without any equipment change.
3. Soiling: Dust, Pollen, Ash, Snow and Bird Droppings
Dirt on glass costs roughly 1 to 5 percent depending on how long it has been accumulating and how dusty your area is. The sharpest jumps come from environmental events: wildfire smoke and fine ash during fire season, pollen in spring, and leaves or sap in autumn. Snow cover can wipe out most of a day’s production until it melts.
If your last professional cleaning was more than a year ago in a dusty or high-tree area, soiling deserves a check before anything else.
4. Normal Panel Degradation
Modern panels are warranted to keep at least 80 percent of rated output after roughly 25 years, which is the rule of thumb people call the 20 percent rule. Losing somewhere near a third of nameplate over a 25 to 30 year life is the expectation some owners hold, usually called the 33 percent rule. Real-world loss runs closer to 0.5 to 1 percent in year one and about 0.3 to 0.7 percent per year after that.
That means a two-year-old system can reasonably sit 1 to 2 percent below where it was at commissioning. Anything much steeper needs a different explanation.
5. Inverter, Wiring, and Connection Faults
When something is genuinely wrong, this is where it is. Failed bypass diodes, hot spots, a tripped breaker, a corroded connector, a cracked junction box, or an inverter that has stopped restarting after a grid event all show up as a real drop.
Microinverters and string inverters fail at very different rates, and the difference is hard to pin down because manufacturers rarely publish field failure data and the hardware is too new for long-run studies to exist. What you can observe matters more: on a microinverter system, one unit failing usually drops a single panel to near zero while the rest of the array keeps running normally. A string inverter takes the whole array down at once.
6. Inverter Clipping and Export Limits
When panels make more DC power than the inverter can convert, the surplus is clipped. This is by design, and it is normal on clear days, especially with a generous DC-to-AC ratio. If your inverter shows a clipping notice during midday, that is a sizing choice, not a defect.
7. Monitoring and Communication Dropouts
A gap in your app’s data is not the same as a gap in production. If the inverter loses its network connection, the portal may show zero, a flat line, or “no data” for hours while the array is generating normally.
| Cause | Typical impact | First check |
|---|---|---|
| Panel heat on clear days | 5 to 15 percent at peak | Compare a hot clear day with a mild clear day |
| Shading on part of the roof | 5 to 30 percent system-wide | Watch the array at solar noon for shadow edges |
| Soiling, ash, pollen, snow | 1 to 5 percent, more after storms | Look for a dull or streaked glass surface |
| Annual degradation | About 0.5 to 1 percent per year | Compare the same months across three years |
| Inverter or wiring fault | Often 30 percent or more | Read fault codes and check breakers |
| Inverter clipping | Varies, only at midday peak | Check for a clipping message in the app |
| Monitoring dropout | Looks total, usually isn’t | Compare meter data against portal data |
| Export or credit confusion | Not a production loss at all | Read generation, not credits, on the bill |
How Much Solar Production Should You Expect?
Expected output equals your system size in kilowatts multiplied by your local peak sun hours, multiplied by a system efficiency factor. In practice that works out to roughly 4 kWh per kW of array on a decent summer day and 2 to 3 kWh per kW on a poor winter day in most of the northern hemisphere.
A 7 kW system in a location with roughly 4.5 peak sun hours has a theoretical daily maximum of about 31 kWh before any losses. Apply a realistic efficiency factor of 75 to 85 percent and a fair daily target in summer is roughly 24 to 27 kWh.
The most useful comparison is against the number your installer actually showed you, not a national average. Open your production history and line up the same month from two or three years of records. Owners doing this on solar forums consistently land on roughly 1 to 2 percent annual decline plus whatever the weather did that year, which is the number you should treat as your new baseline.
Also check what the estimate assumed. If it used a low peak sun hours figure or ignored a chimney or a neighbouring building, your system can hit its real target and still miss the printed one.
How Do You Check Whether the Problem Is Shading, Weather, or Equipment?
Run these in order. It takes about twenty minutes and it tells you which category you are in before you spend anything.
1. Compare Several Days, Not One
A single bad afternoon tells you almost nothing. Look at the last two weeks and find out whether this is one weird day or a pattern across many clear days.
2. Check the Weather Record for Your Area
Overcast stretches, smoke haze, heavy rain and snow all cut output hard. Compare your low days against the local record before assuming equipment is at fault.
3. Read the Production Graph, Not Just the Number
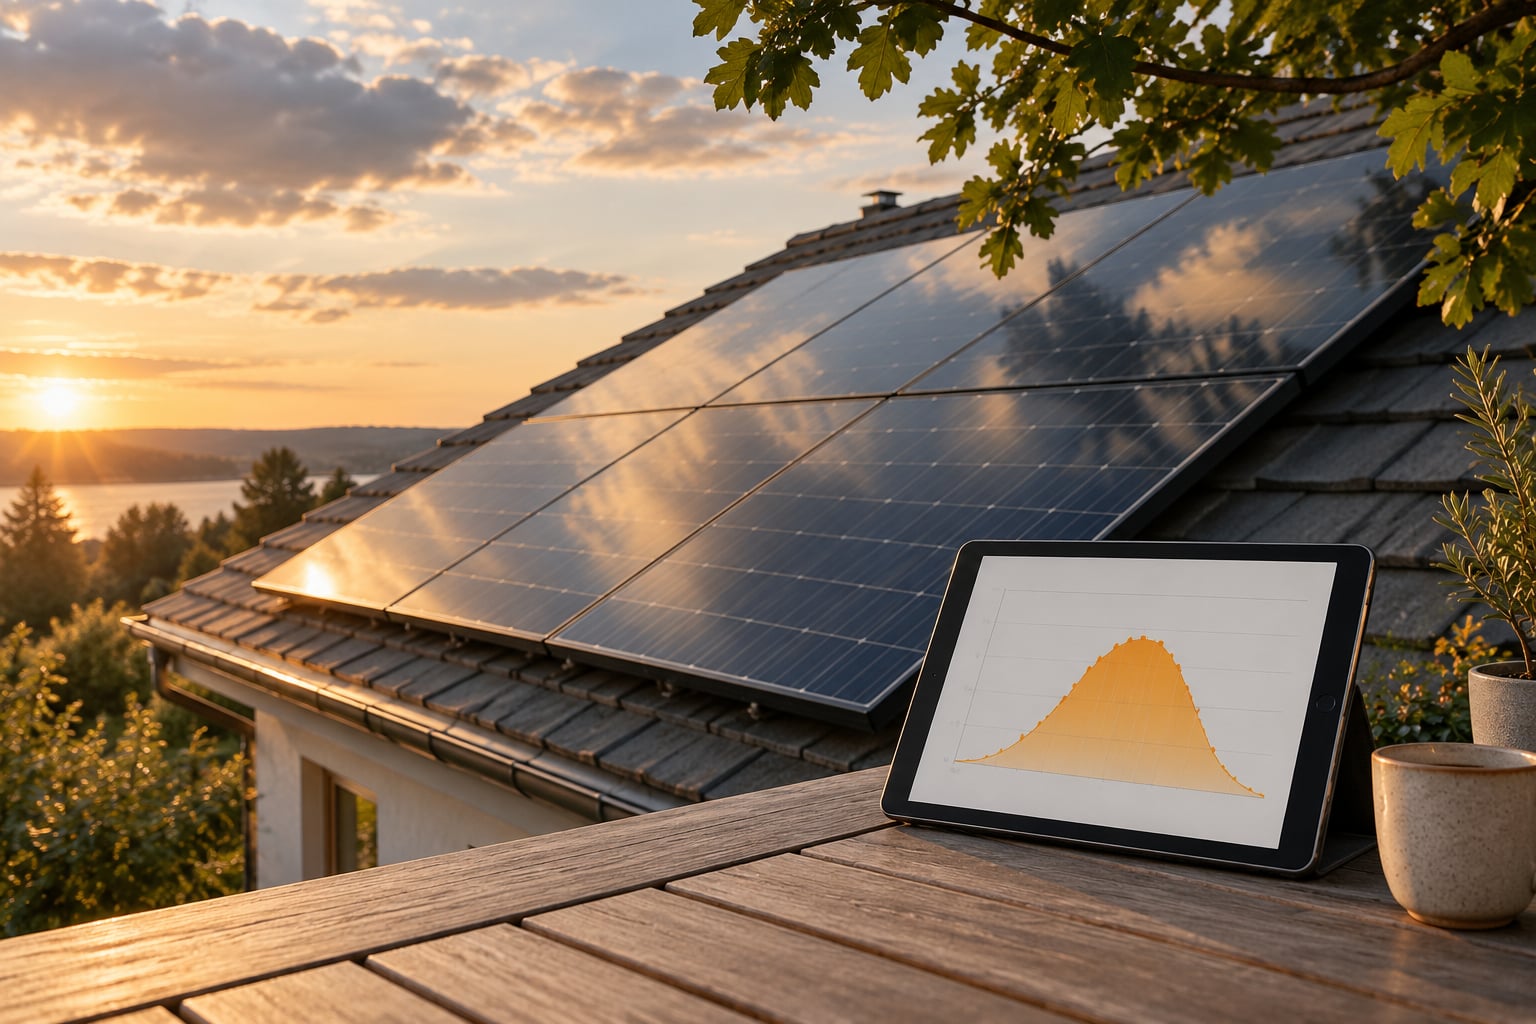
In most monitoring apps you can switch the display between daily generation, weekly generation and system health. Turn on generation, not self-consumption or export. A healthy system produces a smooth bell curve from mid-morning to mid-evening, peaking near solar noon.
4. Look for Per-Panel or Per-Mount Data
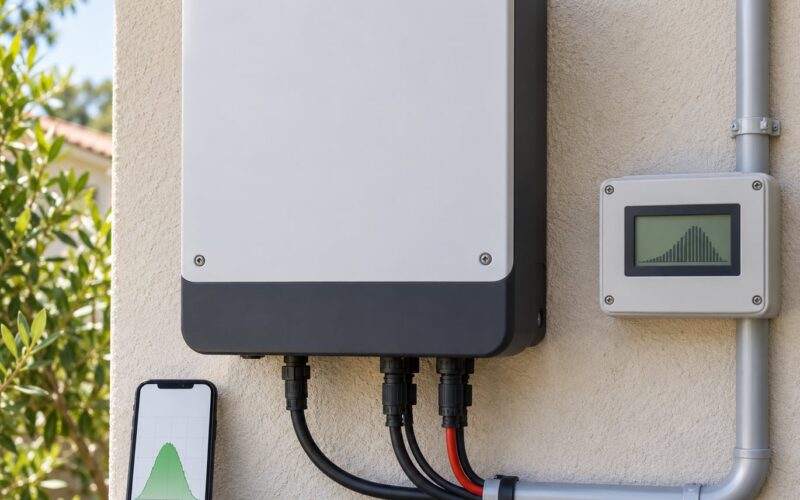
Enphase-style microinverter systems and most modern optimisers report at module level. If one panel sits far below its neighbours on a clear day, that points at shading, soiling or a failed unit on that specific panel. On a plain string inverter system this detail is usually missing, which is exactly the complaint owners raise about consumer monitoring apps.
5. Check Inverter and Meter Notices
Fault codes, derating messages, clipping notices and a breaker or disconnect sitting in a tripped position are all readable without touching anything. A system that derates itself on a hot day is behaving correctly.
6. Compare Generation Against Consumption and Export
If generation looks normal but your bill savings look small, the problem is on the consumption side or in how credits are credited, not in the array. Check whether an export limit, a zero-export setting or a battery charge state is holding production back at midday.
7. Decide From the Pattern
A drop that tracks cloud cover is weather. A drop that tracks tree growth is shading. A drop that appears on one panel or one string on a perfect day is equipment. A flat zero with no fault code is usually a monitoring dropout. Restarting the inverter can clear a communication-related stall, but on forums it keeps coming back, so treat it as a temporary workaround.
What Should You Do When Solar Production Drops Suddenly?
A sudden one-day or one-week collapse and a slow slide over two years are different problems, and they point in different directions.
A sudden collapse during a storm, with no fault code and no physical damage, is often a tripped breaker or an inverter that shut itself off after a grid disturbance. Check your disconnect, read any code on the inverter display, and reset it once according to the manufacturer’s instructions. If it happens repeatedly, stop resetting and call for service.
A sudden collapse that began with a wind or hail event, with visible damage, dislodged panels or a burning smell, is not a DIY situation. Leave the disconnect alone and contact a qualified solar installer or electrician the same day.
Production that drops and then quietly recovers on its own was a communication dropout. Production that drops and stays down, with a fault code, is an equipment fault. Covering a failed bypass diode, a hot spot, a corroded connector or a failed unit usually falls under the workmanship or component warranty, which is why you want to gather screenshots of your production graph and the fault code before you call.
Do not open electrical equipment yourself. Follow your inverter manual, and hand anything behind a panel, a disconnector or a roof edge to a licensed installer.
When Is Low Solar Production a Normal Seasonal Change?
Winter output is lower than summer output for the same system, every year, and it is mostly geometry rather than equipment. Days are shorter, the sun sits lower, and light passes through more atmosphere on the way in. A northern system can lose 40 to 60 percent of its summer daily output at the winter peak, and much of the difference can show up in a single week.
Wildfire smoke and heavy ash seasons can produce a similar dip that has nothing to do with the sun’s angle, and heavy snow cover can flatten production to near zero for several days.
The right way to compare is same month against same month, across at least three years, with the weather noted. Owners who do this consistently see a decline of roughly 1 to 2 percent a year on top of whatever the weather did, which matches the expected degradation curve. A 3 to 5 percent drop in a good weather year is worth raising with your installer, because that is outside the normal band.
If you want an independent figure to test against, work through the maths yourself rather than relying on a national average. Your own monitor’s reported numbers are the trustworthy baseline.
Frequently Asked Questions
Why is my solar production lower on cloudy days?
Clouds block and scatter light before it reaches the panels, so output tracks irradiance almost directly rather than sunshine hours. A bright overcast day may produce 20 to 40 percent of a clear day, and a rainy winter day far less. This is normal and reversible. Only investigate equipment if your clear days are also underperforming.
How much solar production should I expect in winter?
Expect roughly 40 to 60 percent less than your summer daily output in most northern locations, and much less than that during overcast stretches or snow cover. Days are shorter and the sun sits at a low angle, so the array receives less usable light. A 7 kW system producing 25 kWh on a good June day may produce 12 to 15 kWh on a clear December day, and both numbers can be perfectly healthy.
Does tree shading permanently reduce solar panel output?
Shading cuts output for as long as the shadow falls across the panels, so trimming vegetation usually restores generation within days. On a string inverter one shaded panel can drag down the whole run through its bypass diodes, which is why partial shade costs far more than the shaded area suggests. Microinverter systems lose only on the shaded modules. Panels rarely suffer permanent damage.
Why does my solar system show low production but no inverter error?
Usually nothing is actually wrong. No error code means the inverter sees a functioning system, and many conditions that cut output, such as heat derating, midday clipping, export limiting or a monitoring dropout, are normal operating modes rather than faults. If the app shows zero while the meter shows generation, it is a network problem. If real generation is low, check shading and weather first.
Is it normal for solar production to decline each year?
Yes, and the amount is predictable. Panels lose roughly 0.5 to 1 percent in the first year and about 0.3 to 0.7 percent a year after that, and manufacturer warranties generally guarantee around 80 percent of rated output after 25 years. Comparing the same month across three years should show a decline of about 1 to 2 percent a year.
Conclusion
Start by comparing your last two weeks of production against local weather and against the same months in your own history, not against a national average. If clear days are also running short and your monitoring app has per-panel data, look for the one panel or string that is dragging the rest down. That pattern points at a real fault, and screenshots of the graph and any fault code will make the installer call go faster.